2024solar overtook gas
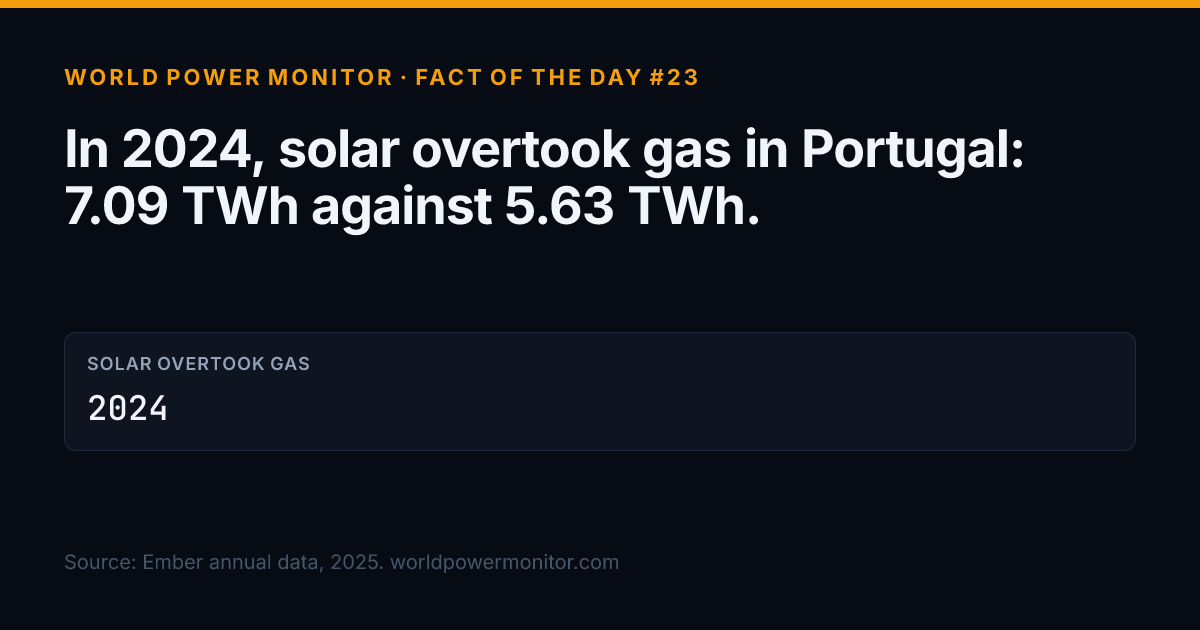
In 2024, solar overtook gas in Portugal: 7.09 TWh against 5.63 TWh.
By 2025, solar generated 8.85 TWh and gas 8.43 TWh.
Source: Ember annual statistics, 2025. Portugal electricity history · Portugal electricity profile
This site keeps your choice on this device, in your browser's local storage (it is not a cookie), so it does not ask again. It also keeps a small cache of its own files so pages load faster.
This site uses Google Analytics 4 to count visits. Before you choose, and if you choose "Accept required", Google Analytics receives an anonymous signal for each page you open, without cookies and without a persistent identifier. Google still receives your IP address, the page address, the referring site and browser details, as any web request does. Google says it uses them for measurement and, while consent is denied, for statistical modelling only. This data can be processed outside your country, including in the United States.
If you choose "Accept all", Google Analytics also sets its own cookies (_ga and _ga_*) to recognise returning visitors and show us which pages, countries and tools are used. Google acts as our processor, and Google signals and ad personalisation are switched off.
If you choose "Accept required", Google Analytics sets no cookies and nothing beyond that anonymous signal is sent. If your browser sends Global Privacy Control, no request is made to Google Analytics at all. The whole site works either way. You can change your choice at any time with "Cookie choices" in the footer.
Week 40 of 2026 (28 September to 4 October 2026) brought 7 daily electricity facts . This is the web version of the emailed issue.
2024solar overtook gas
In 2024, solar overtook gas in Portugal: 7.09 TWh against 5.63 TWh.
By 2025, solar generated 8.85 TWh and gas 8.43 TWh.
Source: Ember annual statistics, 2025. Portugal electricity history · Portugal electricity profile
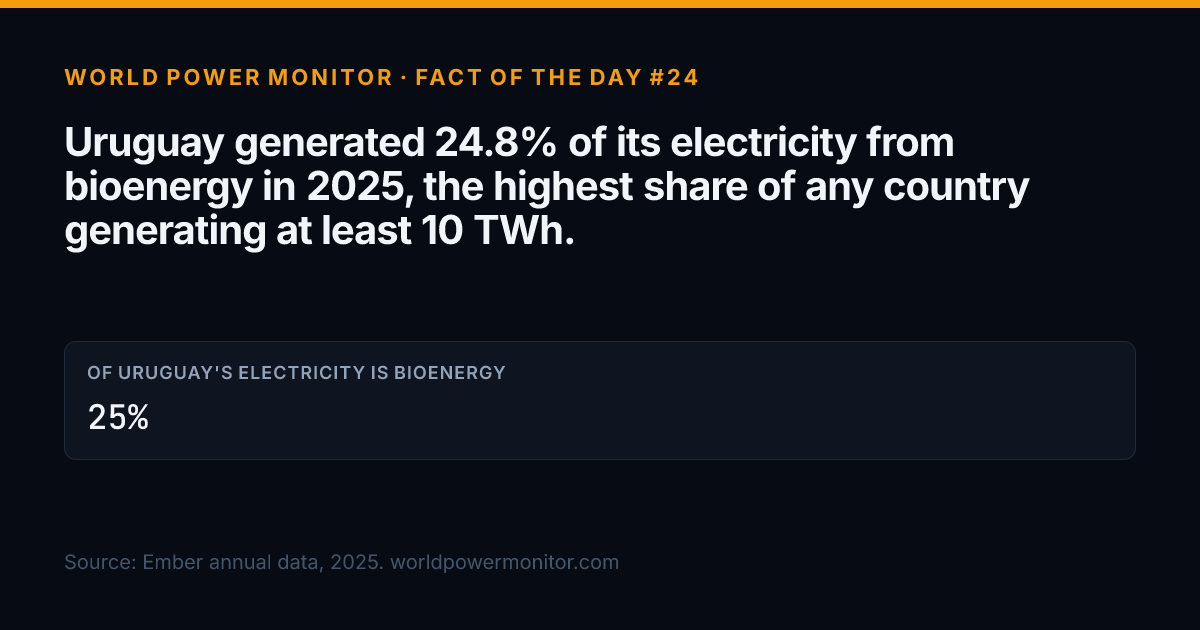
25%of Uruguay's electricity is bioenergy
Uruguay generated 24.8% of its electricity from bioenergy in 2025, the highest share of any country generating at least 10 TWh.
That is 2.97 TWh of the 12.0 TWh it generated. The world average for bioenergy is 2.0%.
Source: Ember annual statistics, 2025. Uruguay electricity profile · Bioenergy power around the world
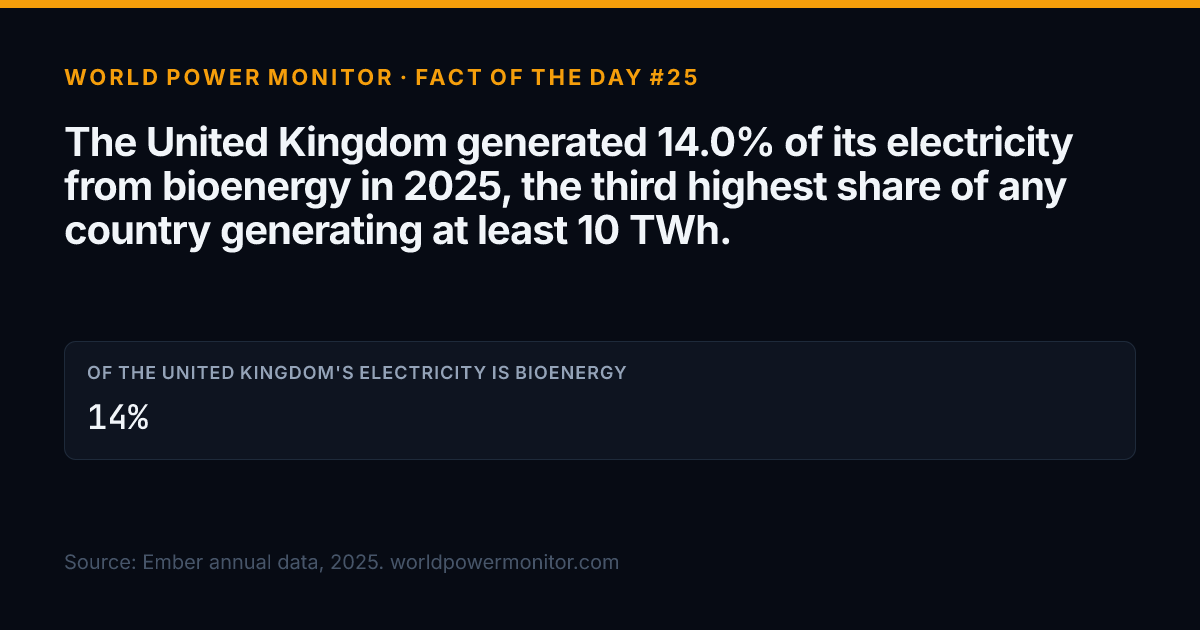
14%of the United Kingdom's electricity is bioenergy
The United Kingdom generated 14.0% of its electricity from bioenergy in 2025, the third highest share of any country generating at least 10 TWh.
That is 40.9 TWh of the 293 TWh it generated. The world average for bioenergy is 2.0%.
Source: Ember annual statistics, 2025. United Kingdom electricity profile · Bioenergy power around the world
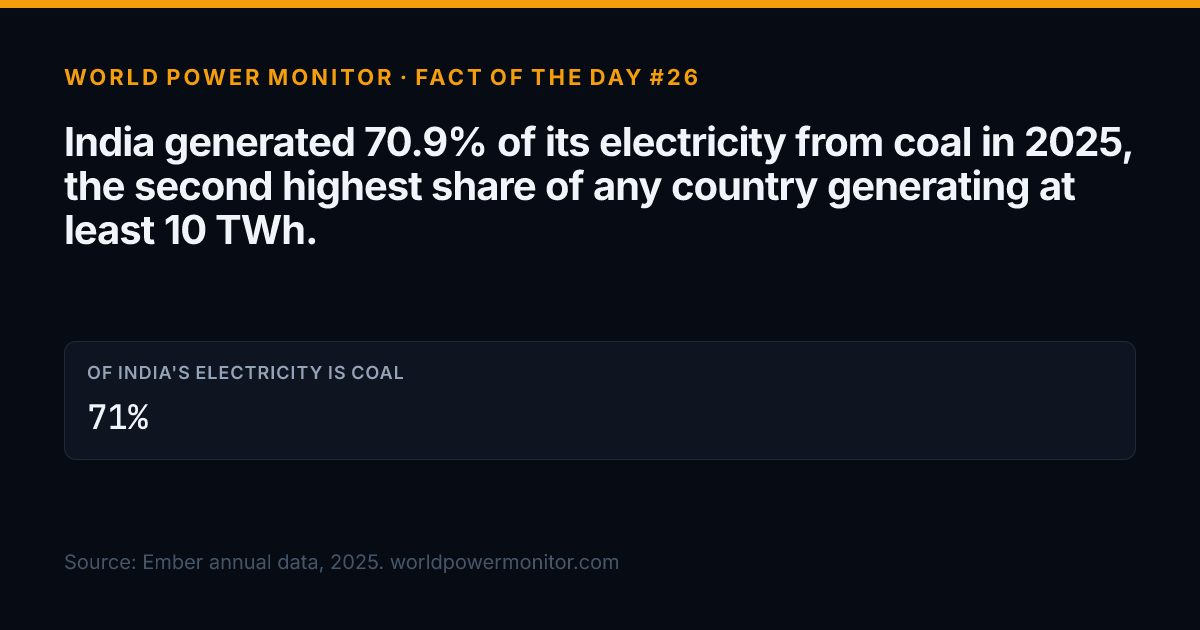
71%of India's electricity is coal
India generated 70.9% of its electricity from coal in 2025, the second highest share of any country generating at least 10 TWh.
That is 1,474 TWh of the 2,080 TWh it generated. The world average for coal is 33.4%.
Source: Ember annual statistics, 2025. India electricity profile · Coal power around the world
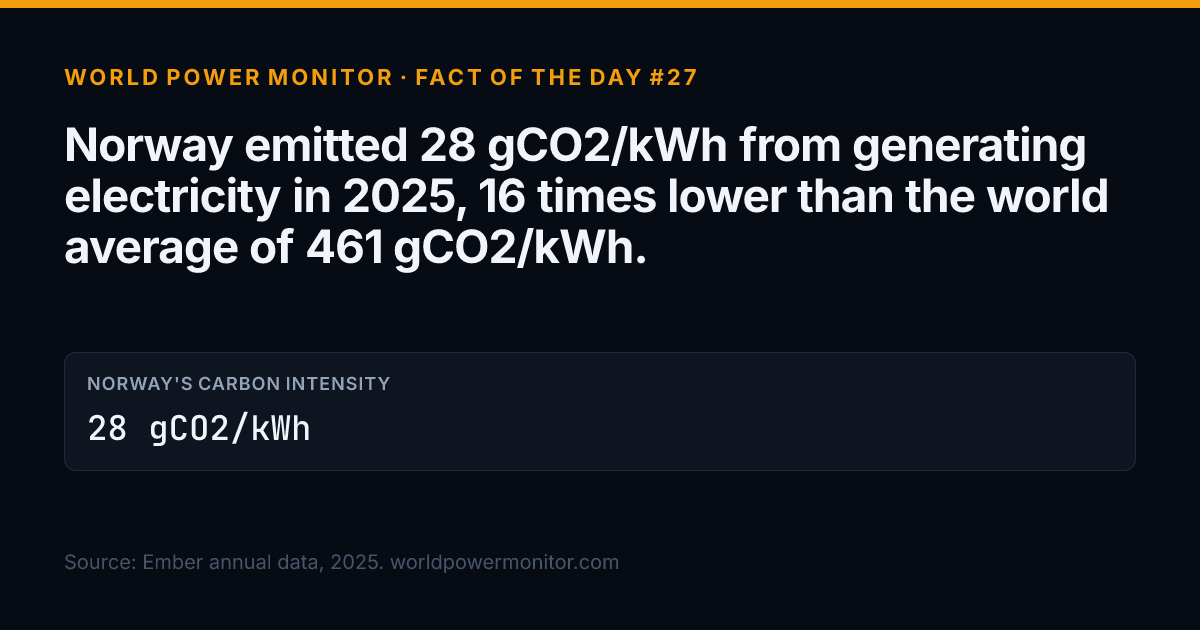
28 gCO2/kWhNorway's carbon intensity
Norway emitted 28 gCO2/kWh from generating electricity in 2025, 16 times lower than the world average of 461 gCO2/kWh.
Carbon intensity counts the CO2 emitted per kilowatt hour generated, including lifecycle emissions from every source.
Source: Ember annual statistics, 2025. Norway electricity profile · Carbon intensity by country
4.4xHungary's solar since 2020
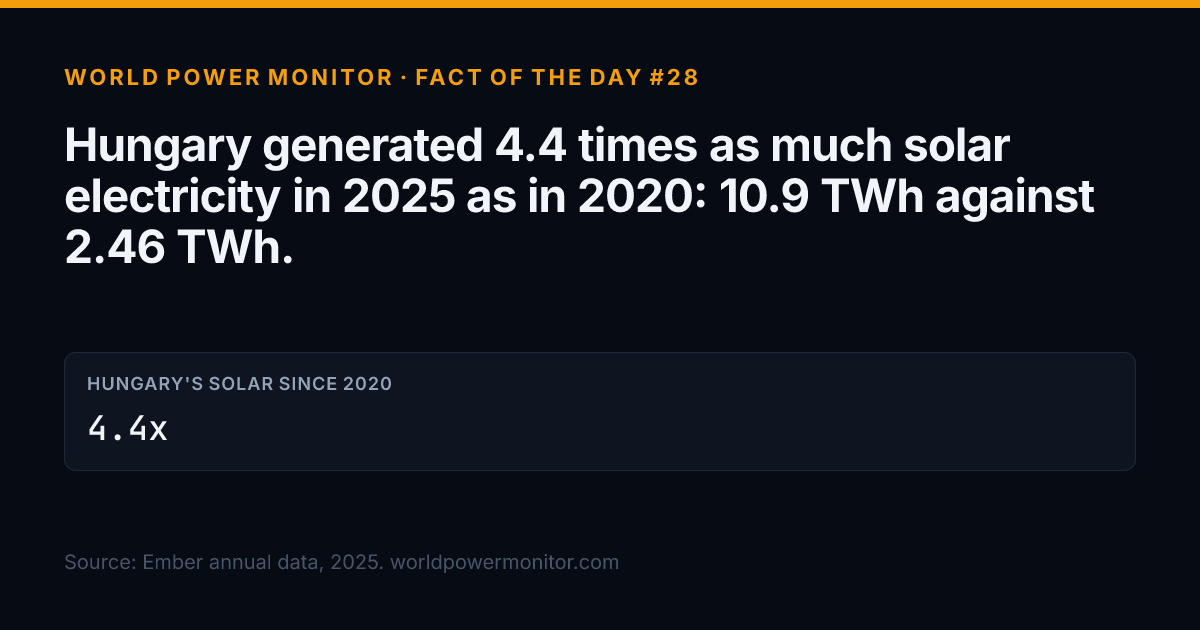
Hungary generated 4.4 times as much solar electricity in 2025 as in 2020: 10.9 TWh against 2.46 TWh.
Solar is now 27.1% of everything Hungary generates.
Source: Ember annual statistics, 2025. Hungary electricity profile · Solar power around the world
24xCanada against Bangladesh
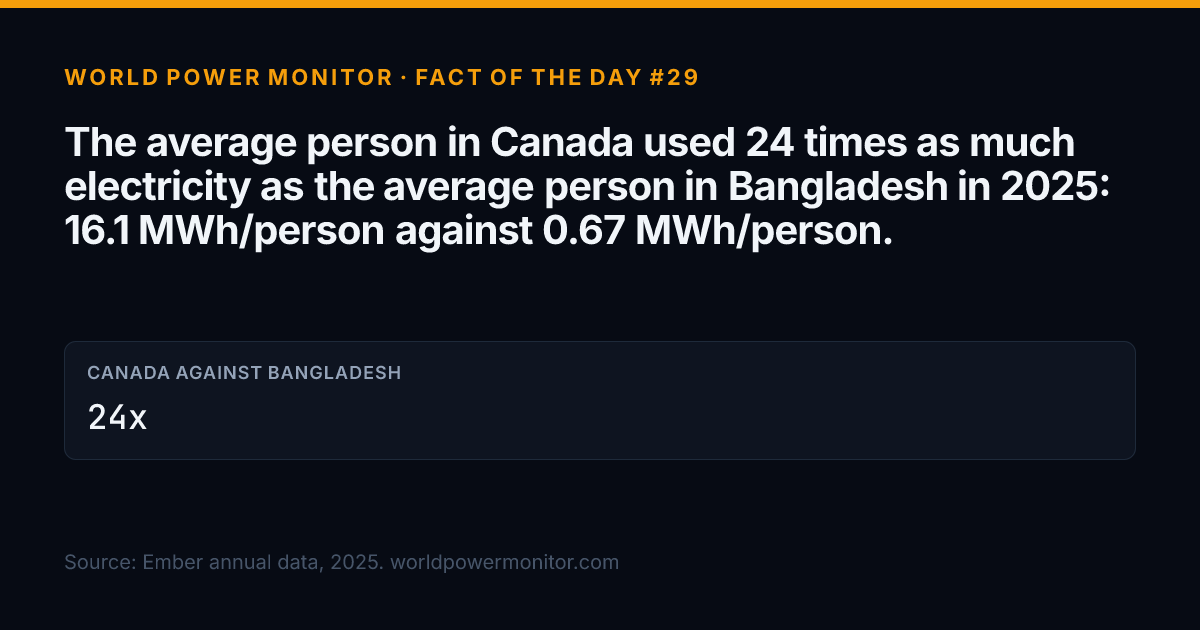
The average person in Canada used 24 times as much electricity as the average person in Bangladesh in 2025: 16.1 MWh/person against 0.67 MWh/person.
Both figures are Ember annual statistics for 2025.
Source: Ember annual statistics, 2025. Canada electricity profile · Bangladesh electricity profile
One email a week: the week's daily electricity facts and power sector news, each with its source and year. No advertising, and you can unsubscribe from any email.
Source: Ember (ember-energy.org), licensed under CC BY 4.0. Data as of 2025. Each fact names its own data year; news items name their publisher.
World Power Monitor. (2026). Weekly Electricity Digest, 28 September to 4 October 2026. https://worldpowermonitor.com/digest/2026-W40/
World Power Monitor. Weekly Electricity Digest, 28 September to 4 October 2026. Data as of 2026-10-04. Data from Ember. https://worldpowermonitor.com/digest/2026-W40/
@misc{wpm_digest_2026_w40_2026,
  title = {{Weekly Electricity Digest, 28 September to 4 October 2026}},
  author = {{World Power Monitor}},
  year = {2026},
  note = {Data as of 2026-10-04. Data from Ember.},
  url = {https://worldpowermonitor.com/digest/2026-W40/}
}
Permalink: https://worldpowermonitor.com/digest/2026-W40/
The Copy buttons add today's date as the access date.